Внесены в Реестр СИ


Identification of acoustic-emission sources during testing of technological equipment with a high noise level //Russian Journal of Nondestructive Testing, May 2015, Volume 51, Issue 5, pp 292-302
Identification of acoustic-emission sources during testing of technological equipment with a high noise level
aStrategiya NK, Severnyi per. 5a, Yekaterinburg, 620014 Russia
email: expert@strategnk.ru, info@strategnk.ru, info@strategnk.ru
b
Ufa State Petroleum Technological University, ul. Kosmonavtov 1, Ufa, Bashkortostan, Russia
email: info@strategnk.ru
Received February 20, 2014
// Russian Journal of Nondestructive Testing, 2015, Vol. 51, No. 5, pp. 292–302
Abstract
The results of using thresholdless data recording during acousticemission testing are pre
sented. A method for processing acousticemission signals that allows the detection of acousticemis
sion sources at a signaltonoise ratio of <1 is proposed.
Keywords: acousticemission testing, thresholdless data recording, adaptive filtering
DOI: 10.1134/S1061830915050034
The urgency of using acousticemission (AE) systems for monitoring the state of equipment increases
from year to year. However, diagnosing technical devices without their decommissioning often has sub
stantial limitations. This is primarily associated with the high sensitivity of the informative parameters of
acoustic emission to noises of different natures. Testing is significantly impeded if there are multiple noise
sources: turbulent or cavitation regimes of the workingmedium motion, synthesis reactions, rubbing
units and parts, electric interferences, vibrations, and other unavoidable technological types of noise that
are not related to the operation of a diagnosed device [1]. As a consequence, an additive noise signal may
appear with an amplitude that far exceeds the signal amplitudes from AE sources that indicate the pres
ence of flaws [2]. Correspondingly, an urgent problem for actual industrial objects is the development of
a noiseimmune algorithm for identifying AE sources, which provides the reliable detection and selection
of an AE signal from a flaw in real time within a wide signaltonoise ratio (SNR) range.
The existing AEtesting systems do not allow one to solve the formulated problem because the main
noisefiltering method reduces to the detection of an AE signal above the preset threshold amplitude
value. The presence of a threshold during data recording involves a loss in the information on a “useful”
signal whose amplitude is below the preset value. As the threshold increases, the testing quality consider
ably decreases down to the impossibility of accomplishing AE measurements. The questions that are
related to interpreting data under the conditions of the presence of highamplitude noises have been
widely developed in the fields that are related to the AE diagnostics of technological equipment. The issue
is the investigation of seismoacoustic emissions [3, 4] and the digital processing of noisy speech signals
[5, 6]. The principles that were expounded in [5] are identical to the situation of AE testing with threshold
data recording and represent a solution that has an expert nature. The threshold value is determined by the
microphone type and the noise level in the facility. The high stability of the obtained recognition results
directly depends on the threshold value. The authors of [5] pointed out that the method of setting thresh
olds is insufficiently reliable.
An alternative method for solving a noisesuppression problem that was proposed in [3, 6] consists in
the use of multichannel adaptive spatial filters in the selfadaptation mode. This allowed the filtering sys
tem to be tuned with respect to the signal–noise mixture (as in the case of AE testing when it is impossible
to record “pure” noise). As was noted by the authors of paper [3], the operation of such filters is not as
stable and efficient as that of filters that are adapted with respect to “pure noise.” The use of the proposed
approach made it possible to obtain a tool for suppressing intense technogeneous noise when analyzing
seismic data. Another promising method that was presented in [4] is a technique for predicting the seismic
activity using the nonlineardynamics apparatus. It should be noted that in this case the determining con
dition is the presence of an undistorted signal, i.e., the absence of a threshold during data recording. The
validity of this approach is associated with the fact that a system that is studied in seismoacoustics is not
chaotic and, hence, it is possible to forecast its behavior, as well as the AEsignal propagation phenomena
in a material. The principles that were expounded in [3, 4, 6] did not establish special requirements for the
noise level and the nature of the noise and an important condition is the recording of an undistorted signal.
The objective of this study is the development of a method for recording and processing data of AE test
ing that allows the detection of an AE signal from a flaw in the presence of highamplitude noise. In this
case, the key feature of the proposed approach is the use of the thresholdless datarecording (TDR) prin
ciple.
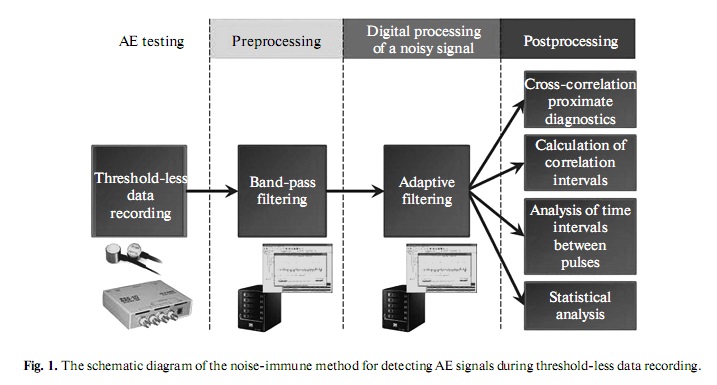
Below, we present the results of applying a noiseimmune method for AEdata analysis, which is based
on the realization of a scheme of a multistage adaptive storage–detector of a signal from a flaw in highly
noisepolluted experimental AE time series. The schematic diagram of the adaptive filtering of a highly
noisy AE signal is shown in Fig. 1.
METHODOLOGICAL SECTION
1. The Principle of Thresholdless AE Data Recording
The idea of TDR was described in [7] and primarily implies the exclusion of a detector–discriminator,
which is present in all existing AE systems, from the testing scheme. The rejection of the amplitudedis
crimination principle allowed us to achieve continuous signal recording without losing the information
content. Owing to this, the TDR that underlies the scheme (Fig. 1) allows one to calculate the spectral,
correlation, and local static and dynamic characteristics without information losses.
It is important that in this case the level of noise and different types of interference may exceed the sig
nal level from a flaw. In this case, the filtering problems are solved already not by using hardware via setting
a discrimination threshold in the analog form but by using software that is based on modern methods for
filtering experimental data (the fast Fourier transform, maincomponents method, adaptivefiltering
method, etc.).
2. Preliminary Data Preparation
The conclusion on the necessity of the preliminary preparation of AE data was drawn on the basis of
studies of the characteristics of inputsignal spectra. In particular, the analysis of the amplitude spectra
allowed the regions that are characteristic of only the noise component and the noninformative highfre
quency signal region to be revealed. Introducing a prefiltering procedure using a bandpass filter made it
possible to increase the SNR.
3. Adaptive Filtering of an AcousticEmission Signal
When AE testing of real industrial objects is performed, an AE signal is significantly distorted by noise;
in this case, the application of digital adaptive filtering (AF) systems, whose parameters can be adjusted
depending on the spectral, correlation, and statistical characteristics of input signals, is promising. The
application of adaptive mechanisms is justified when performing the AE diagnostics of actual equipment,
when the parameters of a recorded AE signal are unknown or change with time. Adaptive algorithms suc
cessfully detect a useful signal in the presence of intense noises of different natures and a priori unknown
parameters [8].
No information on the use of adaptive filters in the AE diagnostics and construction of noiseimmune
systems for detecting weak AE signals on their basis is present in the modern literature. A standard adap
tive algorithm for direct identification with learning [8] was tested in [9] when solving the problem of AE
monitoring of a defective state of a tested object during its deep plastic deformation. However, it is signif
icant that the AF procedure was not used in [9] for extracting an AE pulse signal from a noise time series
but for reconstructing the signal shape, which was distorted by weak technological noise under the condi
tions when the SNR obviously exceeded unity.
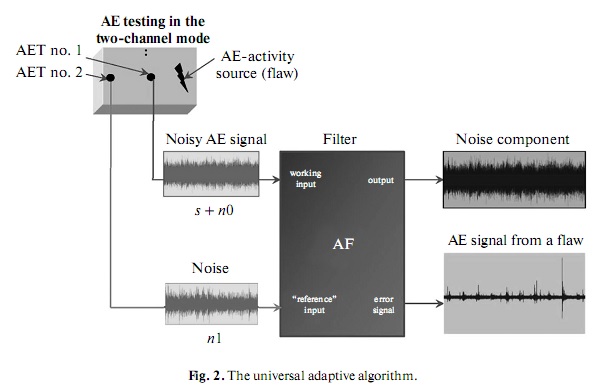
3.1. Adaptive Filtering with Two Information Channels at the Input
The classical scheme of using an AF as a noise suppressor is based on the use of a reference (noise) sig
nal [10]. In a general case, the filter operation implies the use of two separate acousticemission transduc
ers (AETs), viz., independent information channels. In this case, one transducer, as is shown in Fig. 2
(AET no. 2) must be far from potential flaws (AE sources) in the tested object. A signal is transmitted to a
receiver in the form of a mixture of a useful signal, which is initiated by the presence of a flaw, and a noise
component; the AF input signal is s + n0. An auxiliary transducer records the noise, n1, that is not corre
lated with the signal but directly correlates with the noise, n0. Noise n1 is a reference signal for the noise
suppressing device. The task of the AF is to transform the input signal so as to maximally approximate it
to the reference signal. Because only the noise component of the reference signal is correlated with the
input signal, an estimate of noise that is present in the input signal will be obtained at the filter output after
the adaptation process is over. As a result of noise filtering, a signal is formed. This signal is subtracted from
the input signal, thus forming a useful signal, a socalled error signal e (Fig. 3). The filtering error is min
imized via a feedback and a corresponding numerical algorithm (e.g., the leastsquares method [10]). The
AF scheme in the twochannel operating mode was realized earlier as applied to the detection of a weak
periodic AE signal in highamplitude noise [7] and was described in detail in [11].
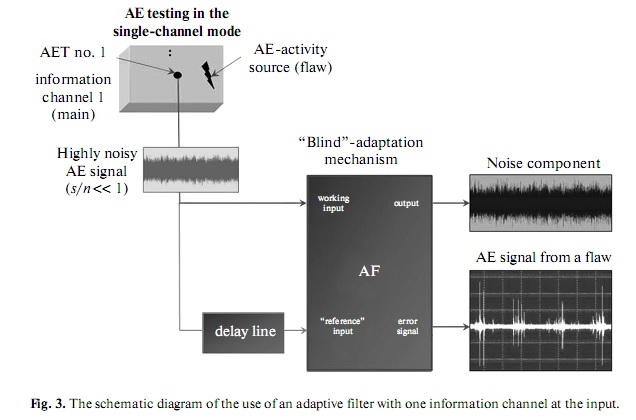
3.2. Adaptive Filtering with One Information Channel at the Input
The absence of an AE signal from a flaw in the region where an auxiliary transducer is installed is a
determining condition for the working capacity of the classical AF scheme. The latter condition is not
always fulfilled during AE diagnostics of actual objects because an uncertainty in the flaw location in the
tested object is a priori present. In this respect, the AF scheme with one input information channel is
much more important for practice, especially when constructing AE monitoring systems in real time. This
channel contains only a recorded time series consisting of an additive mixture of an AE signal and noise,
which arrives from a single AET that is positioned near the flaw–AE source in the tested object. In this
study, the singlechannel AF structure was implemented by modifying the filtering algorithm, which
allowed the “blind”adaptation scenario to be accomplished [10]. The essence of the proposed approach
consists in the setting of a time delay that is equivalent to the introduction of a virtual standard signal (Fig. 3).
The delay value is determined by the ratio of the noise and signal correlation times (see below).
To estimate the filteringalgorithm efficiency, numerical criteria are proposed that are based on the dif
ference between the statistical, spectral, and correlation properties of a signal from a flaw and stationary
noise. For this purpose, postprocessing of the AF data was performed, which consisted of four indepen
dent stages: the crosscorrelation proximate diagnostics, calculation of the correlation intervals, analysis
of time intervals between pulses, and the statistical analysis of an AE signal and noise.
4. EXPERIMENTAL TECHNIQUE
This paper describes the analysis and processing of data that were obtained during AE testing of a vessel
that had a crack on its case [12]. Files were recorded using an LCard E2010 datacollection card and the
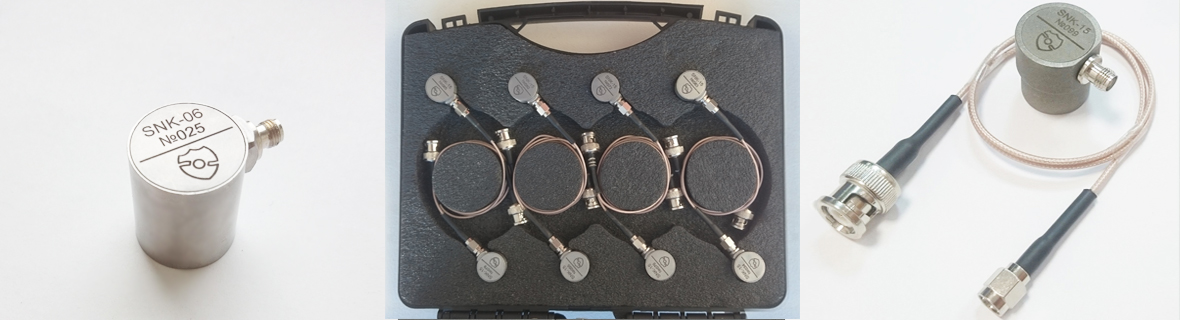
recording was conducted in the twochannel mode. To record the signal, noise, and their mixture, wide
band piezoelectric acoustic AE transducers of the GT200 type (Global Test, Sarov) were used. A highly
noisy input signal was created using synthesized highamplitude interference (surrogate data [13]), whose
amplitude–frequency characteristic is identical to a noise signal that was obtained during testing. Intro
ducing random mixing of the initialsignal phase and samples fully excludes the possible crosscorrelation of a
signal and noise, with the additive character of the investigated signal being preserved. Exactly this statement of
the problem is of interest from the standpoint of detecting a signal from a flaw. The SNR that was calculated
from the AEsignal and noise power within the recordingsystem passband did not exceed 0.03.
RESULTS
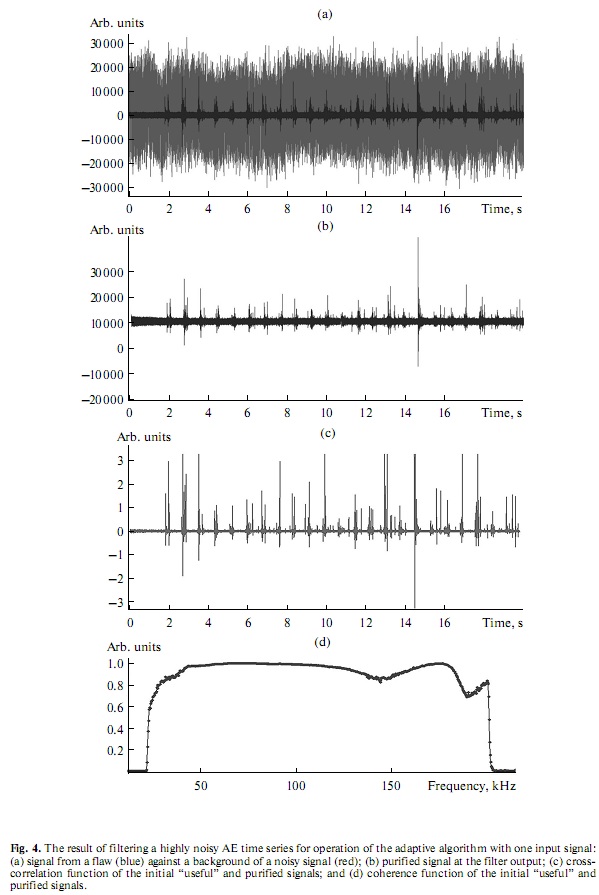
1. Detection of AE Signals and Estimation of the Filtering Quality
Figure 4 shows a typical result of applying the AF with one information input for detecting a nonperi
odic AE signal that is contained in highamplitude noise. As is seen in Figs. 4a and 4b, the AF efficiently
detects the signal from a flaw. In this case, the number of false (or missed) pulses is within 10%. To estimate
the filtering quality, the functions of the cross correlation, AE coherence, and the signalcorrelation coef
ficient at the filter input and output were calculated [14]. The crosscorrelation and coherence functions
determine the degree of signal similarity in the time and spectral (frequency) domains, respectively. The
correlation coefficient characterizes the degree of statistical correlation of signals and is close to unity, if
this correlation is linear (Figs. 4c, 4d). Figure 4c shows that the positions of the maxima of the crosscor
relation function on the time axis coincide with the corresponding AEsignal pulses at the AF input and
output, and the coherence function in the recorded frequency band slightly differs from unity (Fig. 4d).
In this case, the value of the Pearson correlation coefficient was found to be 0.2035. This indicates a non
linear statistical interrelation of AE signals at the AF input and output with a high degree of similarity in
the time and frequency domains. This allows one to go over to the identification of AE sources on the basis
of analyzing the spectral, correlation, and statistical properties of signals and noise at the AF output.
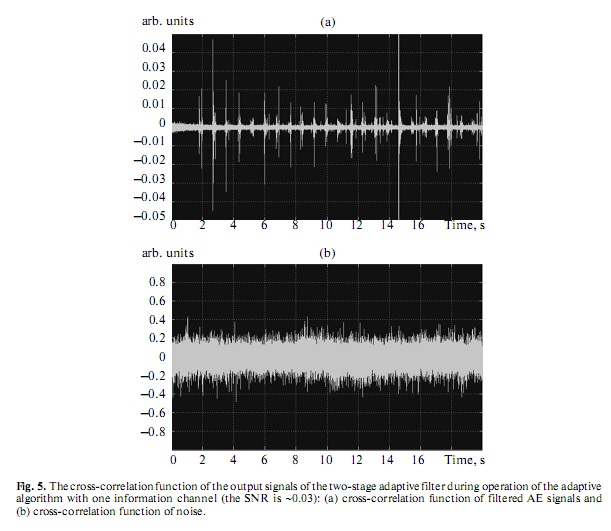
2. CrossCorrelation Proximate Diagnostics
The crosscorrelation proximate diagnostics of data that were obtained after the AF procedure can be
performed upon the introduction of an additional independent AET that records a noisy AE signal. The
postprocessing involves the calculation of the crosscorrelation function (CCF) between useful signals at
the outputs of the twostage AF and their corresponding noise components. Figure 5 shows the results of
calculating the CCF. It is seen that the deterministic AE signals that have a common source in the tested
object are strongly correlated (Fig. 5a), while a correlation is virtually absent between random noise com
ponents that undergo additional phase distortions (Fig. 5b). Thus, an increase in the cross correlation in
the output channels of the adaptive detector may serve as an important diagnostic indication of the occur
rence of nucleating flaws in the tested object.
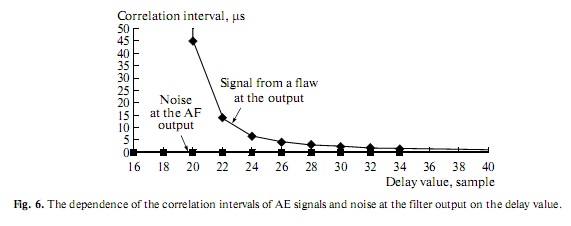
3. Calculation of Correlation Intervals
The value of the correlation interval is a numerical estimate of the degree of signal correlation:
where R is the value of the autocorrelation function, and σ2
is the signal variance.
The filtering quality decreases with a decrease in the difference between the correlation intervals of a
signal from a flaw and a noise signal. This circumstance makes it possible to use the proposed criterion for
determining the filtering parameters. This criterion is used to select an optimal delay value (Fig. 3). Figure 6
shows the correlationinterval values for AE signals at the filter outputs for different delay values. A range
of delay values exists for which the correlation interval for a signal from a flaw is much larger than the cor
relation interval in a noise signal. The correlationinterval value for a signal decreases with an increase in
the delay time, while the correlation interval for noise is independent of the delay time. Thus, the corre
lation interval may serve as a diagnostic indication for distinguishing between an AE signal and noise.
4. Analysis of Time Intervals
The analysis of time intervals in an AE signal [15] is based on the use of the distribution function of
time intervals between pulses. The informativeness of this method consists in the possibility of making an
integral estimate of the flawdevelopment dynamics and the stability of this function to spectral and
amplitude distortions during the signal propagation in a tested object. The idea of using this approach is
based on the following. It is known that in stationary random noise, the number of pulses, n, that appear
within a time interval, t, obeys the Poisson distribution
where p is the probability of the occurrence of n pulses within the time interval.
In this case, the distribution function of time intervals between pulses obeys an exponential law. The
distribution function, f(t), which is the probability that the current time interval, t, is within a preset inter
val, has the following form for the Poisson stream:
It is known that the variance and the mean value is [14].
Correspondingly, the ratio for a random Poisson process (stationary noise) is equal to unity.
The presence of an AE signal determines the occurrence of a deterministic component in a random
stream, and, as a result, the distribution function of time intervals between pulses in a signal deviates from
an exponential law [16]. Thus, changes in the characteristics of the distribution function, in particular, a
deviation of the distribution function of time intervals between pulses from an exponential law, is a crite
rion for the presence of a flawproduced signal. The dimensionless parameter α that characterizes the
degree of departure of the distribution function of time intervals between pulses from an exponential law
is calculated from the formula
where σ2 is the variance and is the mean value of the time intervals between pulses.
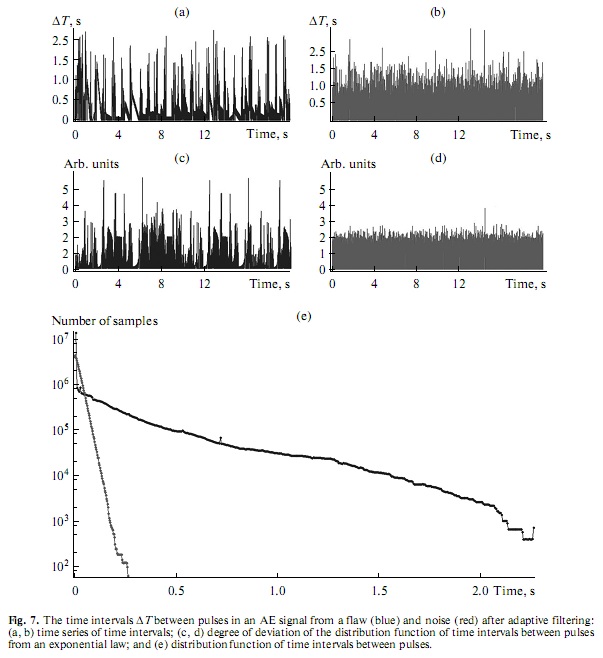
The initial AE signals (ADC samples) and instantaneous powers were used as the initial data. In this
case, the instantaneous power is considered to mean the area that is occupied by the square of the instan
taneous signalamplitude value, which is averaged over the time interval with a specified variance. The
results of signal postprocessing using the analysis of time intervals are shown in Fig. 7. The time series of
time intervals are presented Figs. 7a, 7b. Figure 7e shows that the distribution function of time intervals
between pulses in noise obeys an exponential law, and the noise stream is of a Poisson nature. The distri
bution function of time intervals between pulses in the AE signal demonstrates a significant deviation from
the exponential law. The deviation from the Poisson distribution is determined by the grouping of AE
events. This is confirmed by calculation of the coefficient α (Fig. 7c, 7d). From a comparison with the
characteristic values of the parameter α for noise (Fig. 7d), it follows that the distribution of pulses inside
a group is of a Poisson nature. This allows one to presume that the distribution functions of time intervals
between pulses and the corresponding parameter α can be used as a numerical criterion for detecting a
signal from a flaw in a noisy AE signal.
5. Statistical Analysis
It is known that the amplitude distribution in stationary random noise has a normal (Gaussian) distri
bution [15]. The occurrence of a deterministic component that is related to a source of a signal from a flaw
leads to deviations from a normal law. In order to estimate the statistical characteristics of an AE signal
and noise and to determine the degree of deviation from the normal distribution, the coefficients of asym
metry γ1 (5) and kurtosis γ2 (6) are introduced, since they are independent of the AEpulse stream rate:
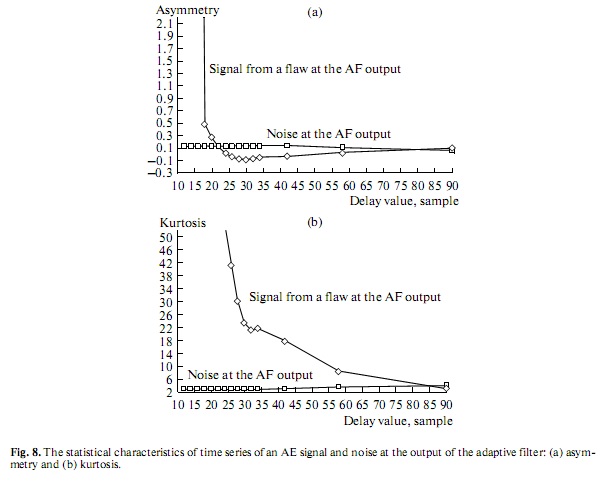
where μ3 is the third central moment and σ is the standard deviation;
where μ4 is the fourth central moment and σ is the standard deviation.
The results of calculating the coefficients of asymmetry γ1 and kurtosis γ2 are presented in Figs. 8a and
8b, respectively. It was revealed that an interval of delay values exists in which the coefficients for AE sig
nals substantially exceed the corresponding values of the coefficients for noise. No dependence of the
asymmetry and kurtosis coefficients for noise on the delay value exists, whereas such a dependence is
present for an AE signal. Thus, the parameters γ1 and γ2 can be used to identify a signal from a flaw and
the noise component. Taking the data into account (Fig. 6), this allows determination of the effective
interval of delay values at the AF input at which the difference of the statistical and correlation properties
of the signal and noise is maximized. Exactly these delay values were used during the filtering of experi
mental data (Fig. 4a).
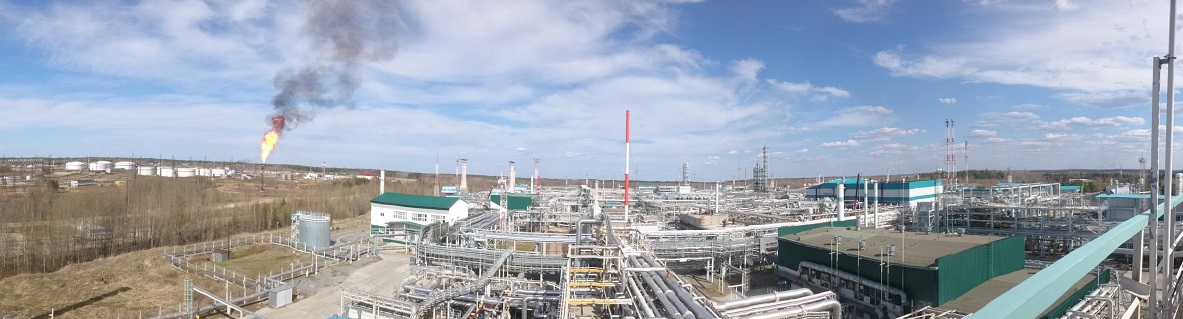
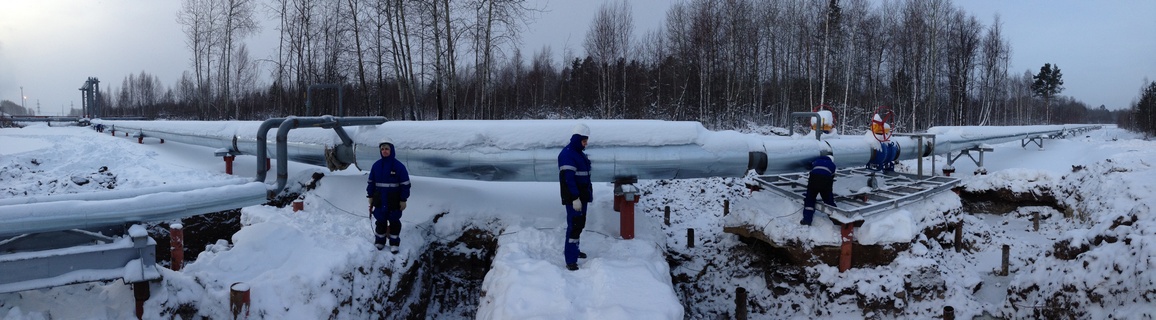
The above-described method for identifying AE sources was used when performing engineering diag
nostics of hotpiping compensators at an operating oilprocessing plant. It is significant that in this case
the TDRbased AEsource identification method was used jointly with a standard threshold AE system.
The simultaneous use of the threshold and thresholdless AE testing systems made it possible to imple
ment the correct detection of AE signals, determine the coordinates, and evaluate the degree of hazard of
sources under the conditions of highamplitude nonstationary operational noise and interference.
A detailed analysis of the AEtesting results in the presence of transient noise and the possibility of con
structing TDRbased monitoring systems is the subject of further investigation.
CONCLUSIONS
(1) It was shown that the application of the TDR method makes it possible to perform efficient AE test
ing under the conditions of highamplitude noise, when the use of existing threshold AEtesting systems
is impossible.
(2) To analyze the TDR AEtesting data under operating conditions in the presence of highamplitude
noise, it was proposed to use an adaptivefiltering algorithm with one input information channel (the
“blind”adaptation mechanism). It was established that the use of the presented filtering technique allows
the reliable detection of an AE signal from a flaw against a highamplitude noise background at an SNR
that is much lower than unity.
(3) It is shown that the optimal AF tuning parameters can be selected and the filteroperation effi
ciency can be evaluated on the basis of calculations of the signal and noise correlation, statistical, and
probabilistic properties. It was concluded that the optimal value of the time delay is determined during
comparative analysis of the dependences of the correlation intervals and highorder central moments of
filter output signals. On the basis of the estimate of the degree of distortion of a filtered AE signal relative
to the initial signal, which is described by the values of the crosscorrelation function (in the time domain)
and the coherence function (in the frequency domain), it was revealed that the used filter correctly recon
structs the shape and time positions of AE pulses.
(4) Quantitative criteria that are used as diagnostic indications of the presence of an AE signal from a
flaw were established: the crosscorrelation coefficient in the output stages of the twochannel adaptive
detector, the correlationinterval value, the asymmetry and kurtosis coefficients, and the degree of devia
tion of the distribution function of time intervals between pulses from an exponential law. The above
parameters can serve as the basis for constructing the system for making decisions on the identification of
flaws during AE testing of the engineering state of equipment under the conditions of highamplitude
noise.
REFERENCES
1. Kuz’min, A.N., Zhukov, A.V., Zhuravlev, D.B., and Styukhin, N.F., Inspection of pipelines using the acoustic emission method, Zh. Rostekhnadzor, 2008, no. 1, pp. 29–31.
2. Kuz’min, A.N., Zhuravlev, D.B., and Filippov, S.Yu., On the issue of engineering diagnostics of heat networks,Zh. Tekhnadzor, 2009, no. 3, pp. 76–77.
3. Chebotareva, I.Ya., Structure and dynamics of a geomedium in noise seismic fields, the methods and experi
mental results, Ezhegod. RAO, 2011, no. 12, pp. 147–156.
4. Novikov, A.V., Application of nonlineardynamics methods for studying the relationship between the microseismic emission and the pore pressure, in Sovremennye problemy fundamental’nykh i prikladnykh nauk—aerofizika
i kosmicheskie issledovaniya: Sbornik trudov 49i nauchnoi konferentsii MFTI (Modern Problems of Basic and
Applied Sciences—Aerophysics and Space Investigations: Proc. of 49th Scientific Conf. of Moscow Physicote
chnical Institute), Moscow, 2006, vol. III.
5. Karpov, O., Gabovich, A.G., Marchenko, B.G., Khoroshko, V.A., and Shcherbak, L.N., Komp’yuternye tekh
nologii raspoznavaniya rechevykh signalov (Computer Technologies for Recognizing Speech Signals), Kiev,
2005.
6. Chuchupal, V.Ya., Chichagov, A.S., and Makovkin, K.A., Tsifrovaya fil’tratsiya zashumlennykh rechevykh sig
nalov (Digital Filtering of Noisy Speech Signals), Vychislitel’nyi tsentr RAN: Moscow, 1998.
7. Aksel’rod, E.G., Davydova, D.G., and Kuz’min, A.N., A noiseimmune method for detecting useful signals in
systems for acousticemission monitoring of hazardous industrial objects, Zh. Tekhnadzor, 2013, no. 5(78),
pp. 86–89.
8. Diniz, P.S.R., Adaptive Filtering: Algorithms and Practical Implementation, Springer, 2013.
9. Haupt, H., Ein auf der Schallemissionsanalyse basierendes Verfahren zur Risserkennung in Umformprozessen:
Diss., pp. 14–194, Uni Paderborn, 2003.
10. Uidrou, B. and Stirnz, S., Adaptivnaya obrabotka signalov (Adaptive Signal Processing), Moscow: Radio i
svyaz', 1989.
11. Shaibakov, R.A., Davydova, D.G., Kuz’min, A.N., Abdrakhmanov, N.Kh., and Markov, A.G., A noiseimmune method of acousticemission monitoring of reservoirs, Neftegaz. Delo: Elektron. Nauch. Zh., 2013, no. 4,
pp. 448–464.
12. Kuz’min, A.N., Zhukov, A.V., and Lukin, V.A., Experimental modeling of destruction processes on defective
metal structures, V Mire Nerazrush. Kontr.: Ezhekvart. Zhurn. Obozr., 2011, no. 1(51), pp. 13–21.
13. Kantz, H. and Schreiber, T., Nonlinear Time Series Analysis, Cambridge: University Press, 2003.
14. Tikhonov, V.I., Statisticheskaya radiotekhnika (Statistical Radio Engineering), Moscow: Radio i svyaz’, 1982.
15. Baranov, V.M., Gritsenko, A.I., and Karasevich, A.M., Akusticheskaya diagnostika i kontrol' na predpriyatiyakh toplivnoenergeticheskogo kompleksa (Acoustic Diagnostics and Inspection at Plants of Fuel and Energy Com
plex), Moscow: Nauka, 1998.
16. Braginskii, A.P., Vinogradov, A.Yu., and Leksovskii, A.M., Acousticemission amplitudefrequency analysis of the deformation kinetics of amorphous metallic glasses, Pis’ma Zh. Tekh. Fiz., 1986, vol. 12, no. 18, pp. 1111–1114.
© 2018 - 2024 ООО «Стратегия НК»